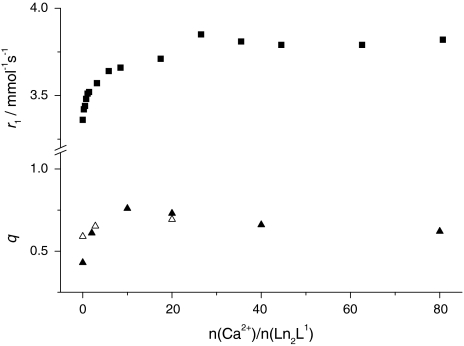
Fig. 3.
Dependence of the relaxivity r1 and of the hydration number q on the Ca2+-to-complex ratio for Ln2L1. Squares correspond to the relaxivity values obtained from the relaxometric titration of Gd2L1 (298 K, 11.75 T). Filled triangles represent the hydration number obtained from luminescence lifetime studies on Eu2L1 and open triangles correspond to the molar fraction of the monohydrated species determined for Eu2L1 by UV–vis spectroscopy (ratio of the integrals of the absorption bands corresponding to monohydrated and nonhydrated complex; see text)

