
Fig. 5.
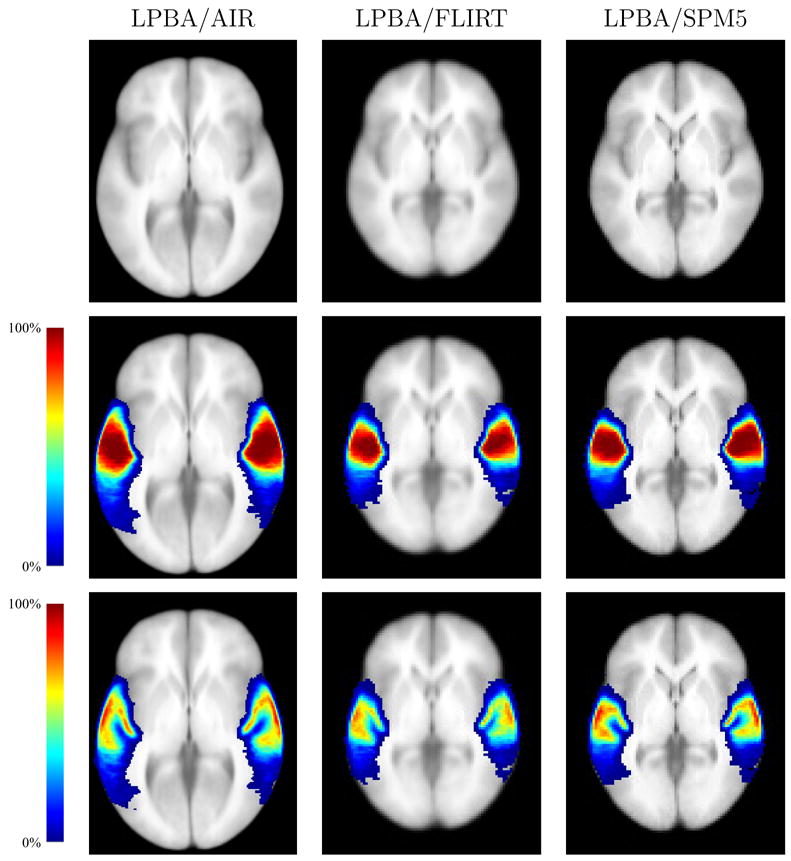
Probability densities for the superior temporal gyrus, computed for each of the three atlas spaces. Each density is superimposed on the average intensity brain image computed for each target space. For the LPBA40/FLIRT and LPBA40/SPM5 images, the slices are taken through the z = 0 plane in SPM5 coordinates for the ICBM152 T1 average; the LPBA40/AIR images were taken from a corresponding plane. All images are shown in neurological convention (anatomical left is displayed on the left) (Top) The average intensity brain image (Middle) The superior temporal gyrus density map (Bottom) The superior temporal gyrus grey matter density map.