
Fig. 9.
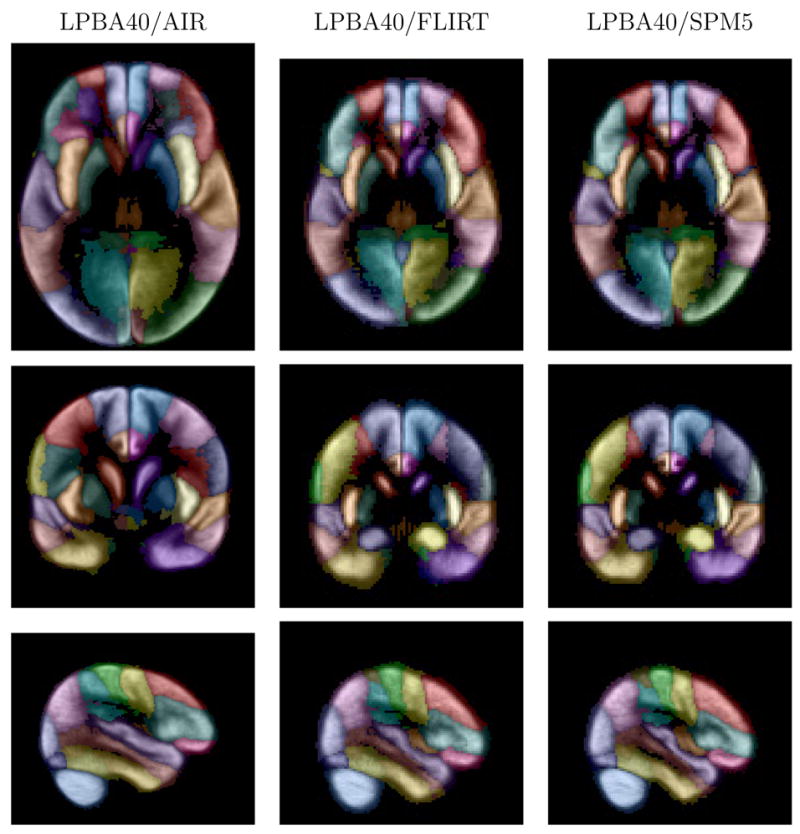
Maximum likelihood grey matter maps. Shown are images from the maximum likelihood grey matter maps for the three versions of the atlas, corresponding to the slices shown in Fig. 7. The intensity represents that maximum probability value at each voxel, computed from the estimated grey matter structure probability density maps. The color indicates the most probable structure (see Table 1). Transaxial and coronal images are displayed in neurological convention (anatomical left is displayed on the left).