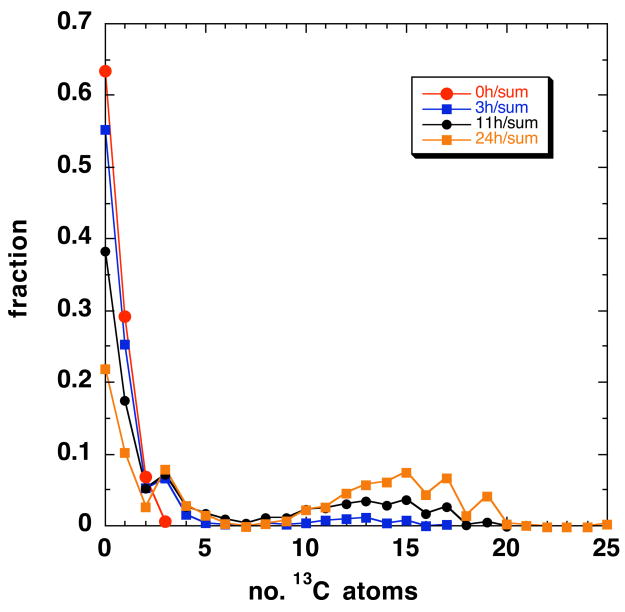
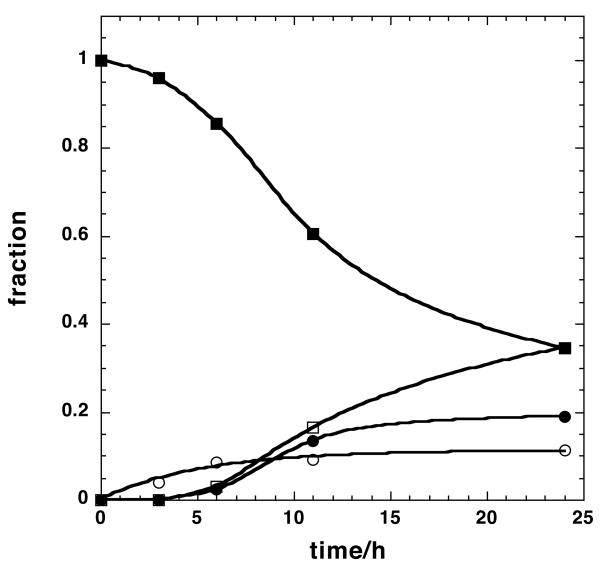
Figure 3. High-resolution FT-ICR mass spectrum of a methanolic extract of LCC2 cells.
A. FT-ICR-MS profile spectrum of an LCC2 methanol extract after 24 h labeling with [U-13C]-glucose. A close up of the m/z region from 760 to 782 is shown. The accurate masses (better than 1 ppm) at high resolution (>100,000 at measured mass) enable assignment of the GPLs and their isotopologues. Masses externally calibrated, and secondarily calibrated with respect to internal standard reserpine and intensities have been arbitrarily scaled to 100 units for m0 at m/z=760.5860.
B. Mass distribution of PC 34:1 normalized to the total intensity as a function of time. The distribution at 0 h is indistinguishable from the expected natural abundance intensity. Line graphs are used here for clarity only; there are no values implied in between the data points
C. Time courses of selected mass peaks. ■ m0, □ m0+3, ● Σ(m0+2n); ❍ Σ(m0+3+2n). The m0+3 intensities were fitted to a(1−exp(−kt)) with a= 0.11±0.008 and k=0.19 ±0.04 h−1


