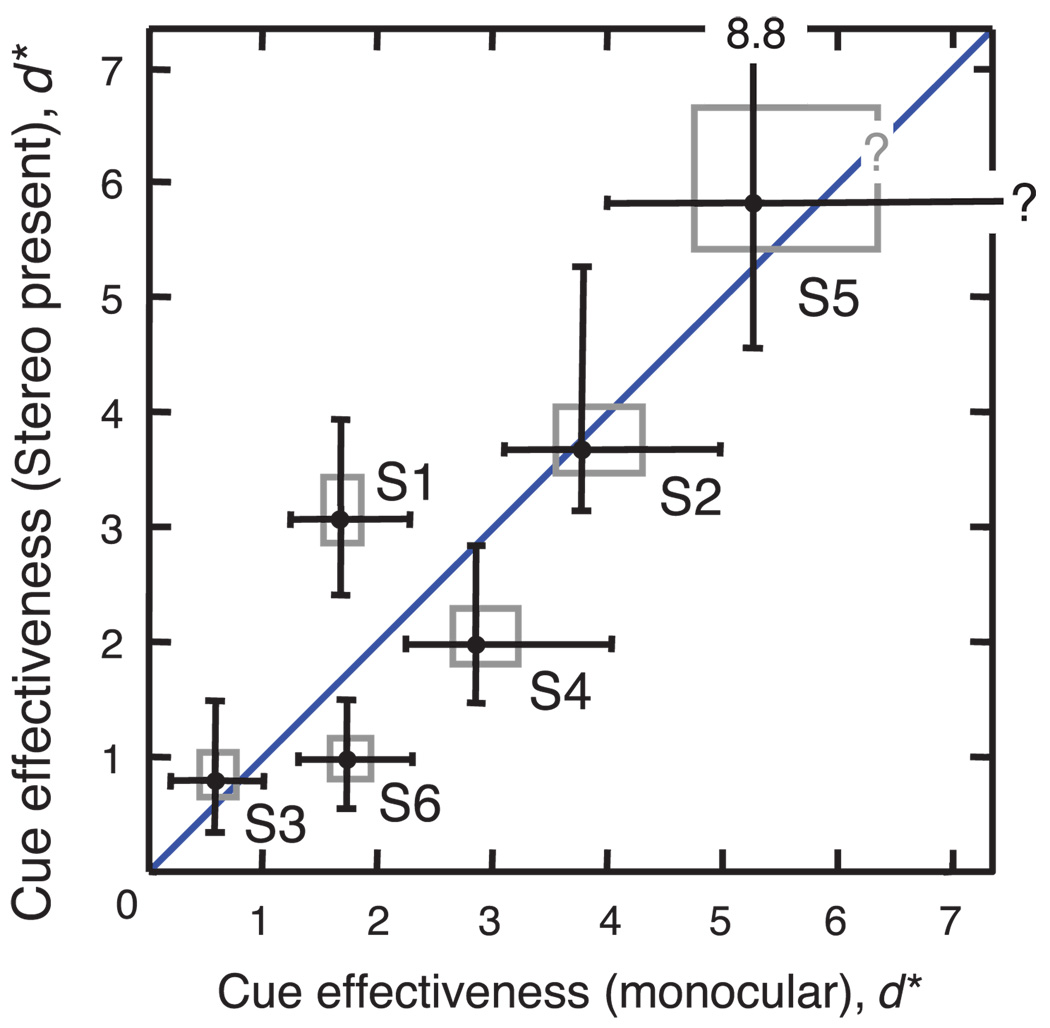
Figure 5.
Comparison of POSN cue effectiveness in monocular and binocular stimuli. Data from the six trainees (S1–S6) in Figure 4 are re-plotted as cue moments (d*) for the POSN cue. Gray boxes show 50% confidence intervals and black bars show 95% confidence intervals, computed using a bootstrap procedure that resampled data and fitted a probit model as in Figure 4. Confidence intervals for trainee S5 could not be reliably estimated from the data.

