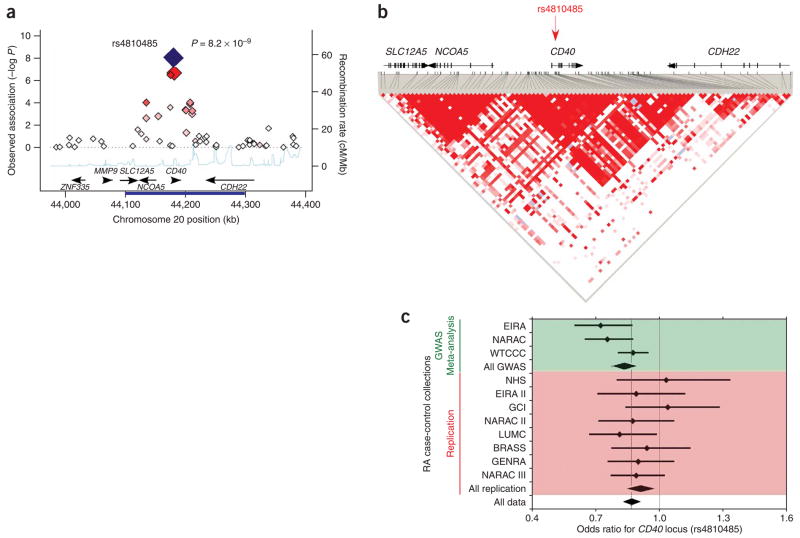
Figure 2.
CD40 region and association with rheumatoid arthritis. (a) Observed association within a 400-kb region surrounding the CD40 locus in meta-analysis of three GWA datasets. We plot the meta-analysis P value on the y axis versus genomic position on chromosome 20 on the x axis. Best associated SNP was rs4810485 (large red diamond). Other data points are shaded with increasing red intensity to suggest LD to rs4810485: dark red signifies r2 ≥ 0.8, orange 0.8 > r2 ≥ 0.5, gray 0.5 > r2 ≥ 0.2, and white r2 < 0.2. In two-tailed joint analysis including all 11 collections, the SNP was strongly associated with risk of rheumatoid arthritis (P = 8.2 × 10⁻⁹, large blue diamond). Along the bottom of the figure we plot the recombination rate with the CEU HapMap (light blue line) and have indicated known human genes (black arrows). (b) The LD structure for a 200-kb region (indicated by dark blue bar along the x axis in a) surrounding the rs4810485 SNP (red arrow). The rs4810485 SNP is located in the second intron of CD40. LD between SNPs is indicated by the redness of individual spots in the triangular graphic, the most intense red spots have a D′ = 1. (c) Forest plot for rs4810485 association across 11 collections. For each sample collection we plot the odds ratio (small diamond) and the 95% CI. A light dashed line indicates the final odds ratio across all collections. The top three bars (green) represent GWA data and the diamond below them summarizes their meta-analyzed effect. The next eight bars (red) represent replication data and the diamond below them summarizes their meta-analyzed effect. The final diamond at the bottom of the page (clear) represents the final meta-analysis odds ratio and the 95% CI for all 11 collections.

