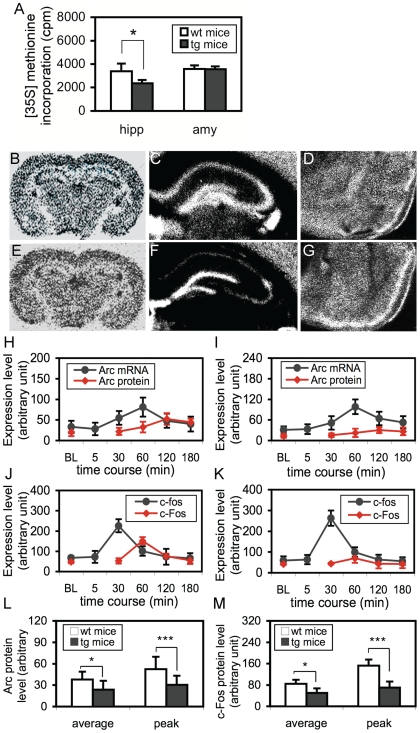
Figure 5. Protein synthesis inhibition in the hippocampus, but not amygdala, of hip-eEF-2K-tg mice.
A. Quantitative analysis of [35S]-methionine incorporation into proteins in the hippocampi (hipp) and amygdalae (amy) from wild-type (wt; n = 6) and hip-eEF-2K-tg (tg) mice (n = 7). *, p<0.05, Student's t test. B and E. Representative autoradiography microphotographs showing protein synthesis inhibition in coronal brain sections from wild-type (B) and hip-eEF-2K-tg mice (E). C and F. A higher magnification of microphotographs showing protein synthesis inhibition in the hippocampus of hip-eEF-2K-tg mice (F), compared to wild-type mice (C). D and G. A higher magnification of microphotographs showing no observable protein synthesis inhibition in the amygdala of hip-eEF-2K-tg mice (G) compared to wild-type mice (D). H and I. Expression of Arc mRNA (black line) and Arc protein (red line) in the hippocampi from wild-type (H; n = 5 in each group) and hip-eEF-2K-tg mice (I; n = 5 in each group). BL: basal line from mice treated with vehicle. J and K. Expression of c-fos mRNA (black line) and c-Fos protein (red line) in the hippocampi from wild-type (J; n = 4 in each group) and hip-eEF-2K-tg mice (K; n = 4 in each group). BL: basal line from mice treated with vehicle. L and M. Quantitative analysis of the expression of Arc protein (L) and c-Fos protein (M) in hippocampi from mice after KA injection at the average level and peak level. *, p>0.05, Student's t test, ***, p<0.001, post hoc test, compared between wild-type (wt) and hip-eEF-2K-tg (tg) mice.

