
Figure 5.
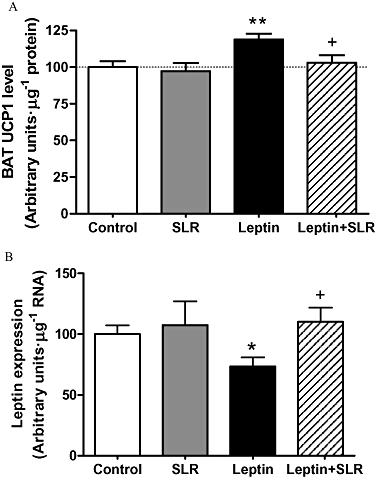
Experiment 3: UCP1 protein levels in BAT (A) and leptin expression levels in EWAT (B) after 7 days of infusion of vehicle, leptin (0.05 mg·day−1, s.c.), SLR (5.5 µg·day−1, i.c.v.) or leptin (0.05 mg·day−1, s.c.) + SLR (5.5 µg·day−1, i.c.v.). Results are expressed in arbitrary units·µg−1 of protein or total RNA and levels in control rats were set to 100, with SE adjusted proportionally. Values are means ± SE of 6–7 animals per group. *P < 0.05, **P < 0.01 versus control; †P < 0.05 versus leptin alone.