
Figure 2.
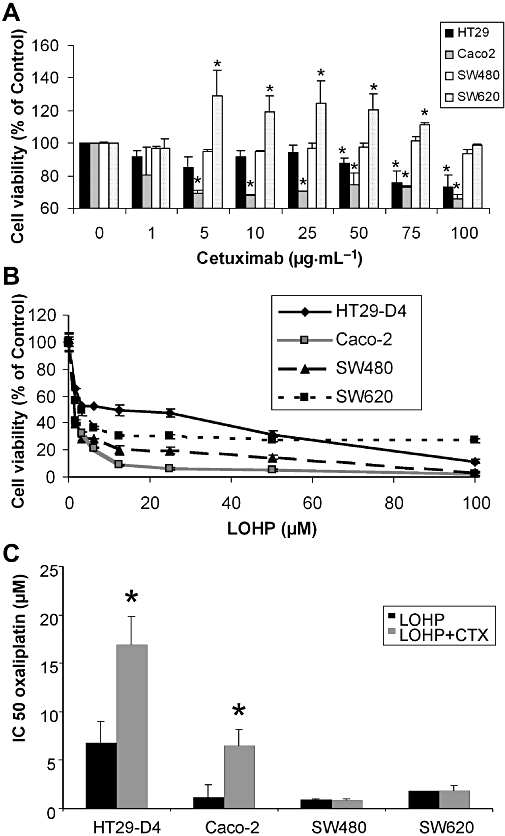
In vitro effects of a single agent, cetuximab (CTX) or oxaliplatin (LOHP), on a panel of human colorectal carcinoma cell lines. (A) Dose–response curves of cells treated with cetuximab alone at concentration ranging from 0.1 to 100 µg·mL−1 for 72 h on each cell lines using methylthiazoletetrazolium (MTT) assays. Results were presented as means ± SEM of three independent experiments. (B) Concentration–response curves of cells treated with oxaliplatin alone at concentrations ranging from 1 to 100 µM for 72 h using MTT assays. Data are expressed as mean ± SEM of three independent experiments. *P < 0.05. (C) IC50 for oxaliplatin combined with cetuximab in the panel of human colorectal carcinoma cell lines. Cells were treated with oxaliplatin at concentration ranging from 1 to 100 µM combined with a fixed cetuximab concentration of 100 µg·mL−1. Cetuximab was added 15 min before oxaliplatin. Growth inhibition was evaluated by using MTT assay. Data are expressed as mean ± SEM of three independent experiments.