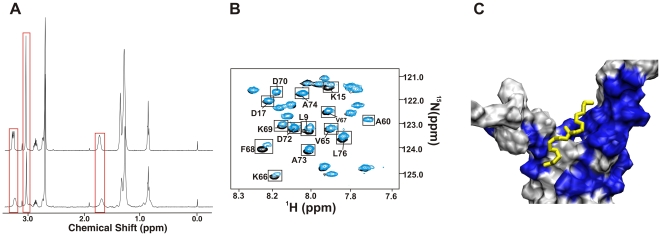
Figure 1. Identification of PrgI Binding Ligands.
(A) DDAB NMR spectra in the absence (top) and presence (bottom) of PrgI illustrating changes in NMR intensities (boxed) upon binding PrgI. Both free and bound 1D 1H NMR spectra were normalized to a constant DMSO signal intensity. (B) Expanded view of the superimposed 2D 15N-1H HSQC spectra of the free and DDAB bound PrgI NMR samples. Residues that incur a chemical shift perturbation are boxed. (C) Expanded view of PrgI surface rendered in VMD [78] where residues that incur a chemical shift change are colored blue and DDAB is colored yellow. Co-structure based on NMR determined ligand binding site using AutoDock [27] and our AutoDockFilter program [24].

