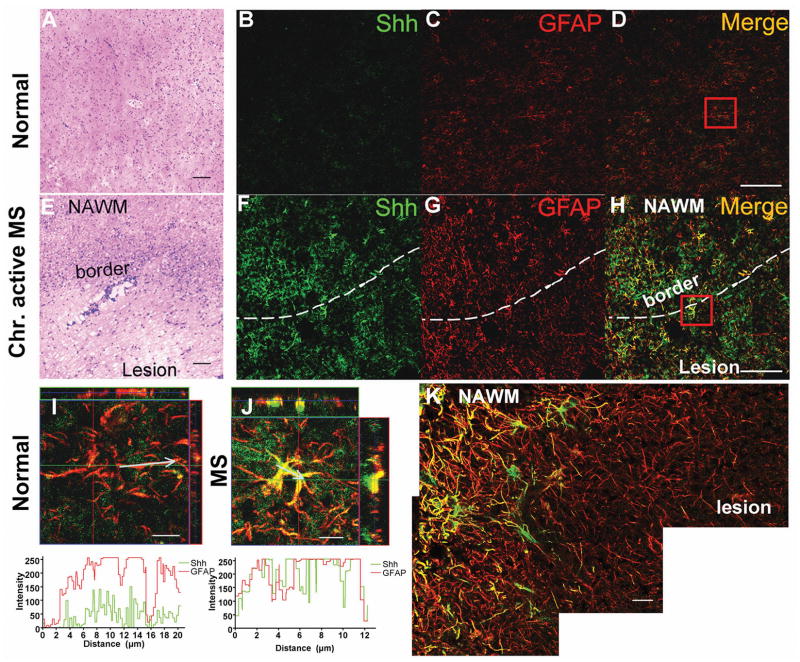
Figure 1. Shh expression in human MS lesions.
(A, E) H&E staining of frozen sections from normal and MS brain. The MS brain shows increased cellularity and perivascular infiltration at the lesion border. Scale bar, 100 μm. Immunofluorescence staining for Shh (green) and GFAP (red) from normal human brain (B, C, D) and chronic active MS lesions (F, G, H) shows upregulation of Shh in hypertrophic astroglia around the MS lesion border and NAWM, less so inside the lesion. Scale bar, 50 μm. (I, J) 3-D view and profile analysis of Shh (green) and GFAP (red) intensity on representative astroglia from normal (D) and MS brain (H) by LSM510 software. The chart indicates the intensity of Shh and GFAP alone the arrow line represented areas in the images. Scale bar, 10 μm. The images were acquired using the same parameters. (K) Stitched image of Shh and GFAP co-expression in chronic active MS lesions, showing Shh is up-regulated around the lesion border and NAWM, but less so inside the lesion. Scale bar, 20 μm. NAWM, normal appearing white matter.

