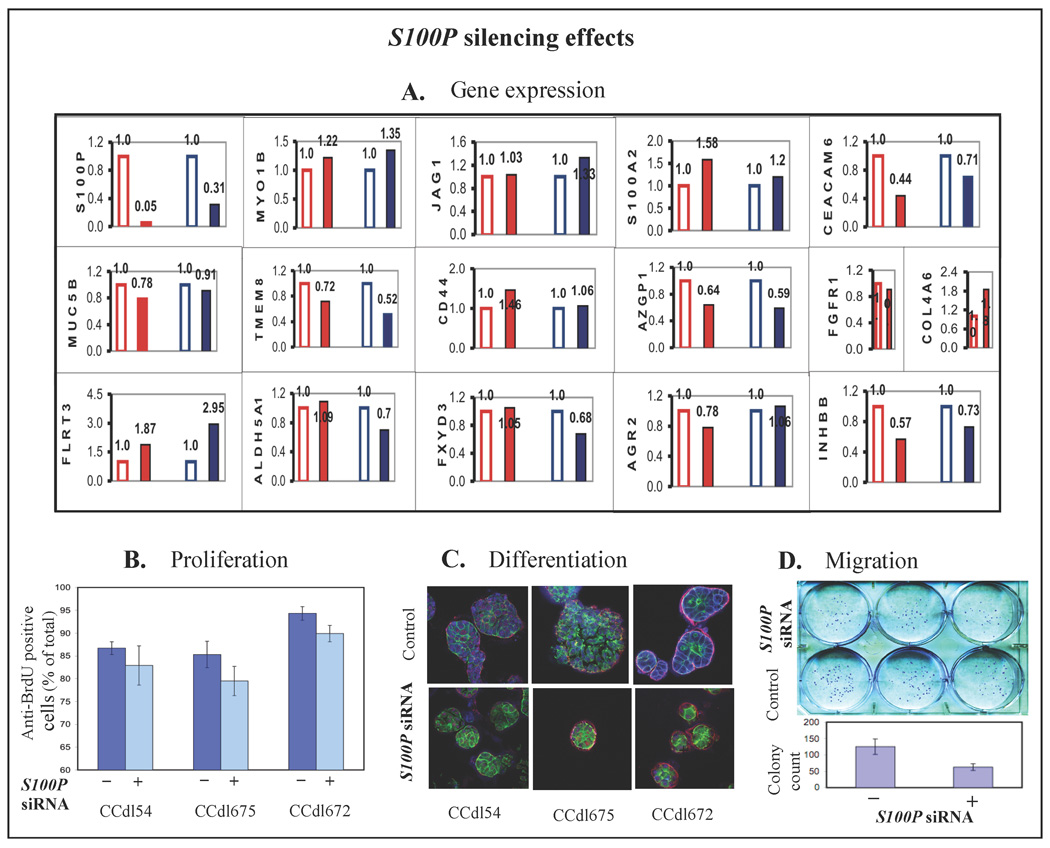
Figure 3. Pleiotropic effects of S100P silencing.
A, Expression levels of S100P-COR genes in HTG cell lines altered by S100P knock down. Red bars - CCdl54. Blue bars - CCdl675. Open bars - control siRNA. Solid bars - S100P siRNA. B, Reduction in the number of anti BrdU stained proliferating cells in 3 HTG cell lines transfected with S100P siRNA. Error bars indicate standard deviation between triplicate assays. C, Apolar morphology of HTG colonies propagated in matrigel (top); normalized by S100P silencing to resemble polarized acinar structures (bottom). Blue - immunolocalization of anti S100P, green – actin localization by phalloidin, and red - immunolocalization of anti integrin alpha6. D, Reduction in migration potential induced by S100P siRNA in HTG cell lines. Standard error bars represent triplicate assays.

