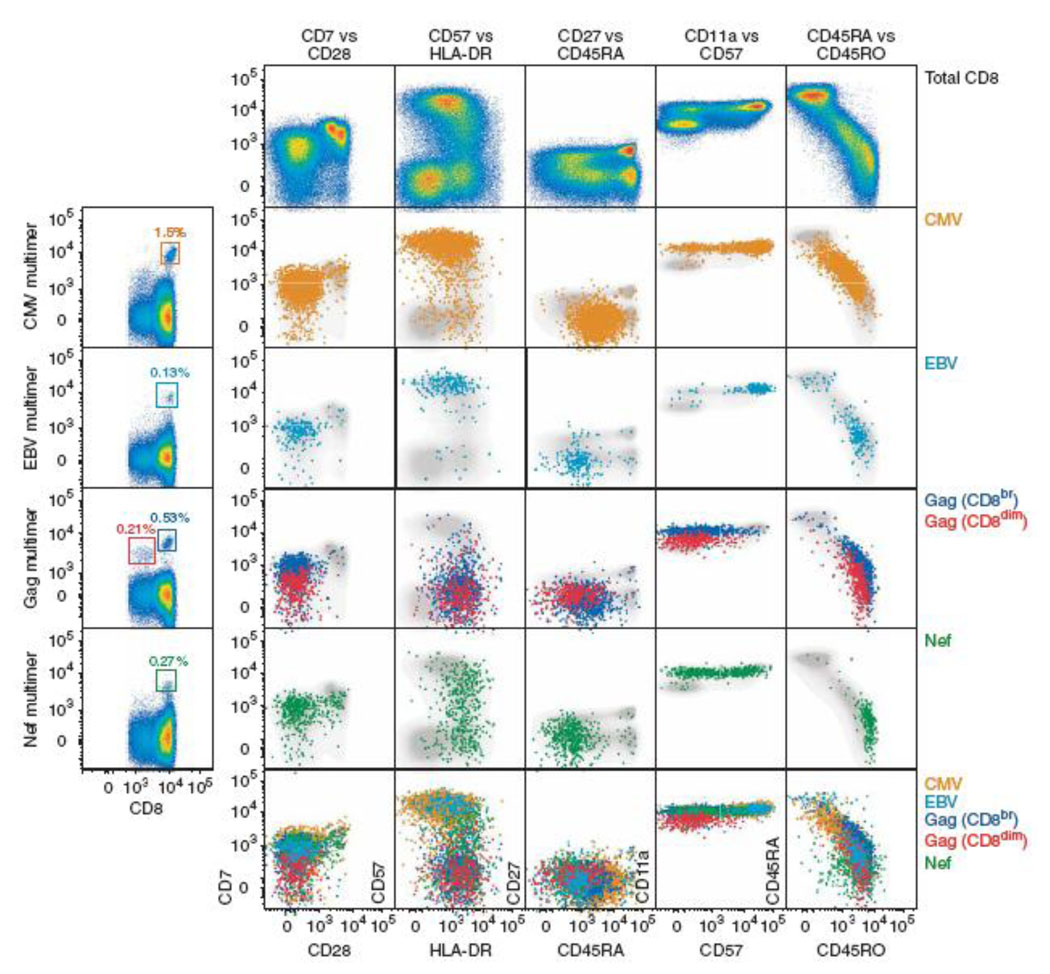
Figure 3.
Seventeen-parameter flow-cytometry analysis of antigen-specific T-cell populations was achieved using 8 QD probes and 9 organic fluorophores. Significant heterogeneity in biomarker expression within a CD8+ T-cell population (shown in gray) emphasizes the need for multi-parameter analysis in studying immune response and other complex systems [25].

