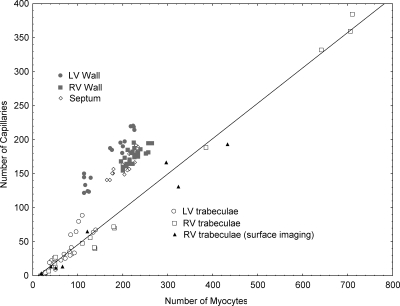
Figure 6.
Scatterplot of the number of capillaries as a function of the number of myocytes arising from: LV free wall, RV free wall, septum, and trabeculae (LV and RV by two different microscopy procedures). Data fitted by linear regression analysis to trabeculae data only: ncapillaries = 0.52 × nmyocytes − 6.46; r2 = 0.988; sy.x = 13.52.

