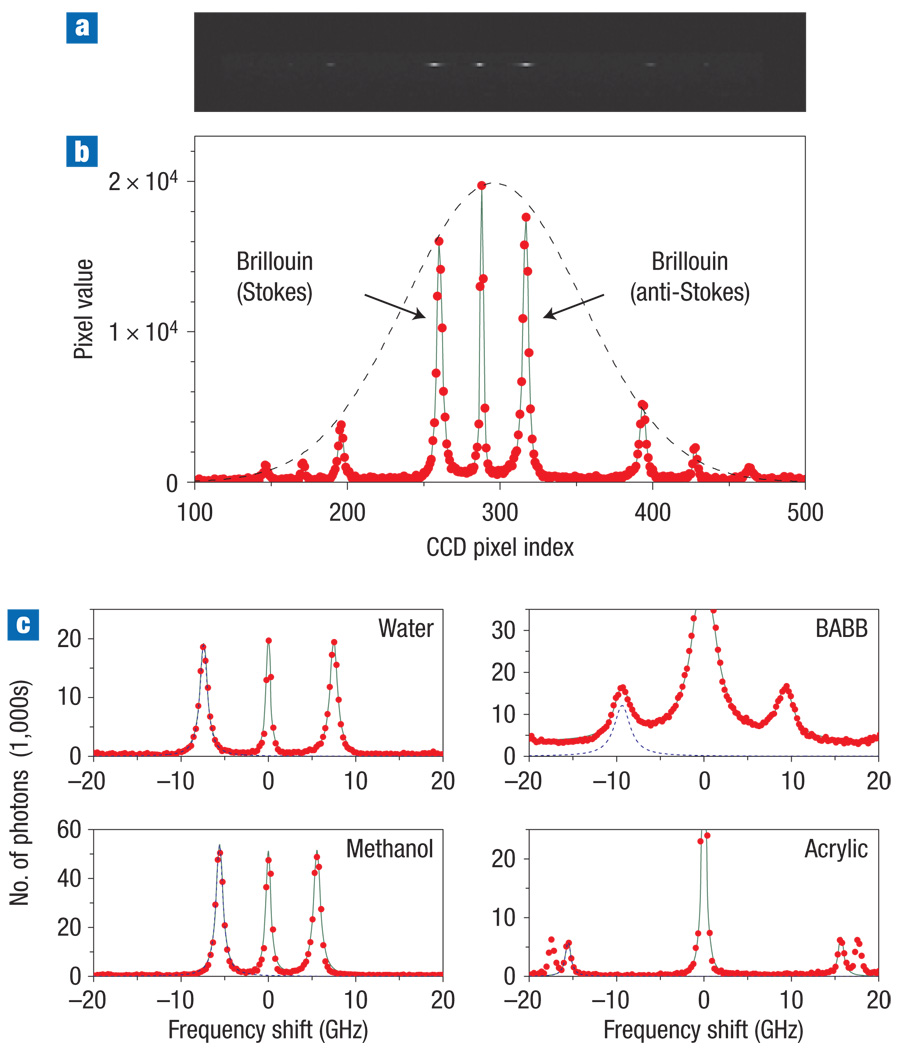
Figure 2. Brillouin spectra of various samples.
a, Typical CCD output obtained from distilled water. b, The width of the transmission profile (dotted line) matched to the FSR to maximize the signal. c, Calibrated optical spectra: experimental data (red circles); overall curve fit based on lorentzian functions (solid green line); and a curve fit to the Stokes Brillouin spectrum (blue dashed line). The measured Brillouin shifts and linewidths are 7.46 GHz and 0.79 GHz for water, 5.57 GHz and 0.46 GHz for methanol, 9.23 GHz and 1.97 GHz for benzyl alcohol and benzyl benzoate (BABB), and 15.6 GHz and 0.26 GHz for acrylic glass (Plexiglas).

