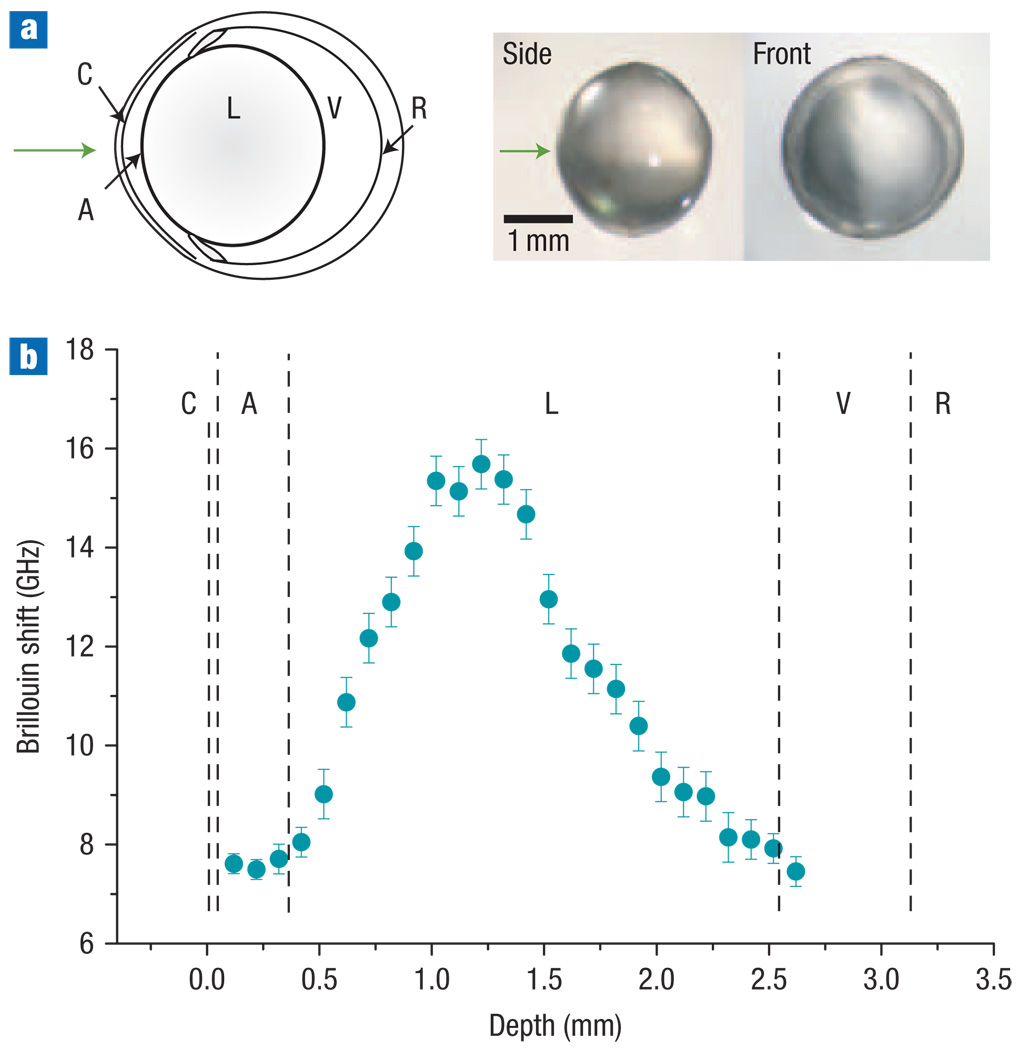
Figure 5. In situ characterization of the crystalline lens in a mouse eye.
a, Left: Schematic of the murine eye. Right: images of the crystalline lens extracted after measurement. The arrow indicates the beam entrance direction. b, Brillouin frequency shifts measured at various depths along the central optic axis (blue circles), showing a twofold increase from the outer layers (cortices) towards the lens centre (nucleus). Error bars represent the measurement uncertainty. C, cornea; A, aqueous humour; L, lens; V, vitreous humour; and R, retina.

