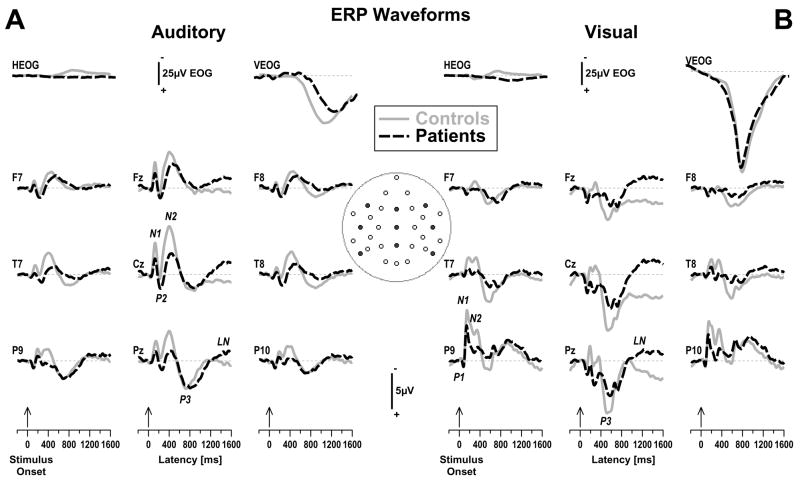
Figure 1.
Nose-referenced, stimulus-locked (−200 to 1600 ms) grand average event-related surface potential (ERP) [μV] waveforms (100 ms pre-stimulus baseline) for auditory (A) and visual (B) stimuli (averaged across old and new items) comparing 20 patients (dashed black lines) and 20 healthy controls (solid gray lines) at selected lateral (F7/8, T7/8, P9/10) and midline (Fz, Cz, Pz) recording sites (indicated by black dots in inset). Horizontal and vertical electrooculograms (EOG) are shown at a smaller scale before blink correction. Distinct ERP components are labeled for auditory stimuli at Cz (N1, P2, N2), for visual stimuli at P9 (P1, N1, N2), and for both modalities at Pz (P3, LN).

