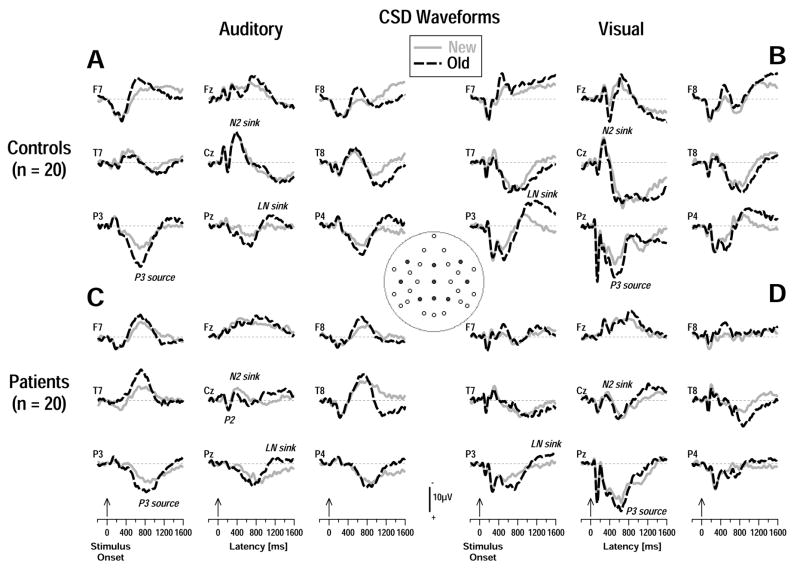
Figure 4.
Stimulus-locked CSD waveforms from controls (A, B) and patients (C, D) for auditory (A, C) and visual (B, D) stimuli comparing old (dashed black lines) and new (solid gray lines) stimuli at selected lateral (F7/8, T7/8, P3/4) and midline (Fz, Cz, Pz) sites (indicated by black dots in inset). Increased medial- and mid-parietal P3 sources (P3/4, Pz) and lateral-frontal sinks (F7/8) were seen for old compared to new auditory and visual stimuli in both groups. These old/new effects, however, were generally smaller in patients.

