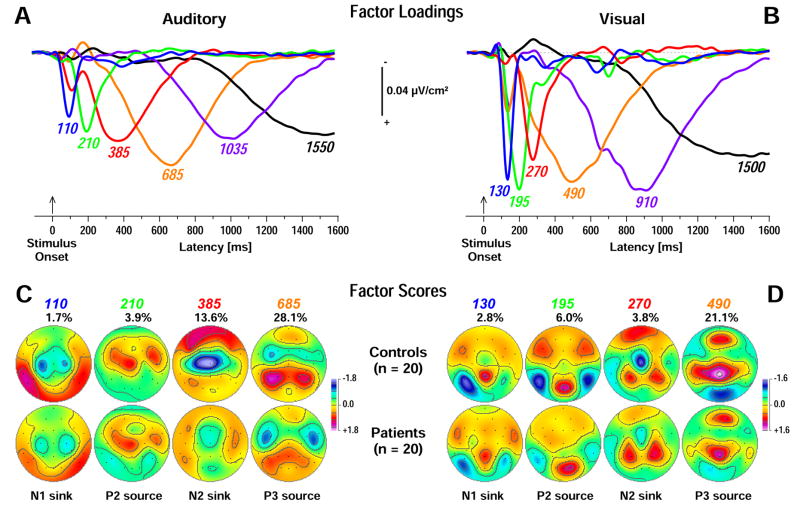
Figure 5.
Unrestricted PCA solutions using auditory (A, C) or visual (B, D) stimulus-locked CSD waveforms. A, B: Time courses of Varimax-rotated covariance loadings for the first six CSD factors extracted for auditory (86.5% total variance explained) or visual (85.2%) stimuli. Labels indicate the peak latency of the factor loadings relative to stimulus onset. C, D: Corresponding factor score topographies (nose at top) with percentage of explained variance for the earliest four factors in each PCA solution (peak latency < 900 ms) corresponding to N1 and N2 sinks and P2 and P3 sources for each modality, separately plotted for controls (top row) and patients (bottom row). The same symmetric scale was used for all topographic maps within a modality.

