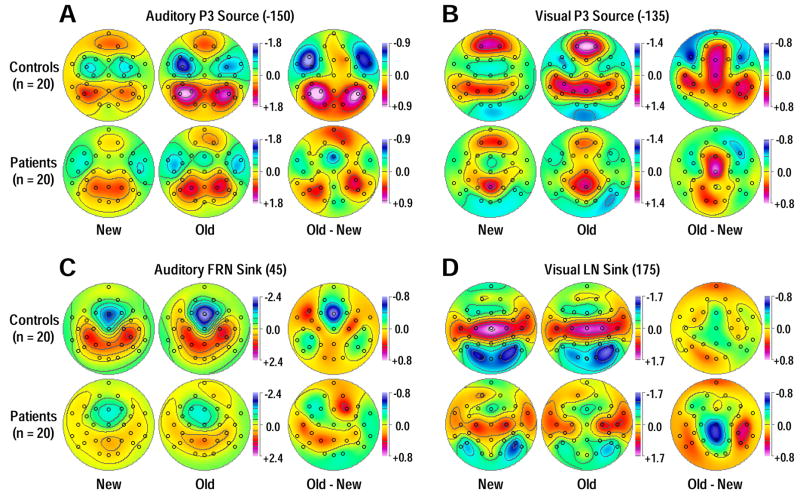
Figure 9.
Mean topographies of CSD-PCA components corresponding to auditory (A; factor −150) and visual (B; factor −135) response-locked P3 source, auditory FRN (C; factor 45) and visual LN sink (D; factor 175). As in Figure 6, topographies are separately shown for controls and patients and for new and old stimuli with their respective old-minus-new difference.

