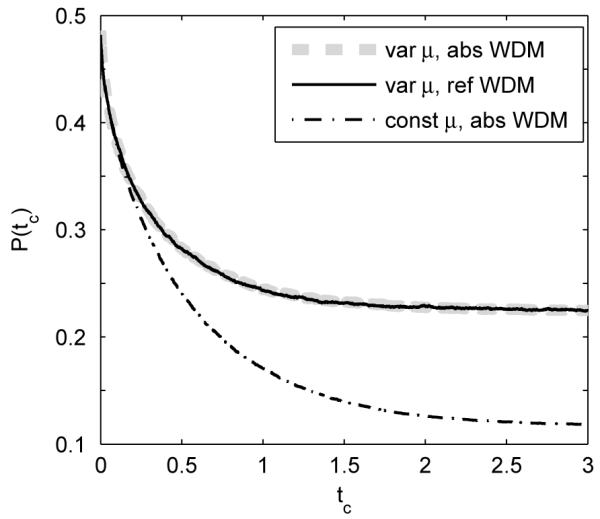
Fig. 6.

Error rates of the bounded WDMs at different tc with variable drift rates across trials sampled from a normal distribution (1,1) (solid and thick dashed), compared with the error rate of the bounded WDM with constant drift rate μ = 1 (dash-dotted). Other model parameters are σ = b = 1. Data are averaged over 100,000 trials.
