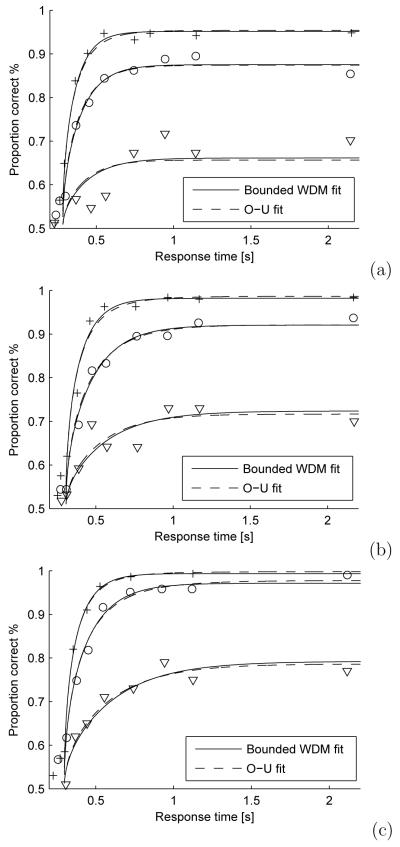
Fig. 9.
Accuracies as a function of reaction time for three subjects in the TC paradigm, from Usher and McClelland (2001). Different symbols indicate different difficulty levels; solid and dashed lines show fits of bounded WDM and O-U models for the three difficulty levels. Estimated parameters used to generate the curves are given in Table 1.

