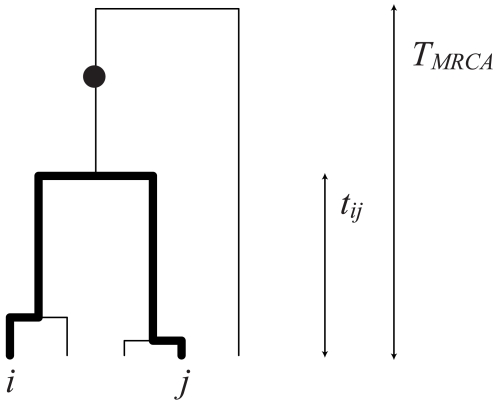
Figure 1. Genealogical statistics.
The chart shows a genealogical tree describing the history of a sample of size five. Two samples,  and
and  , will share a derived mutation (indicated by the circle) if it occurs on the branch between their most recent common ancestor and the common ancestor of the whole sample. The length of this branch is
  .
.

