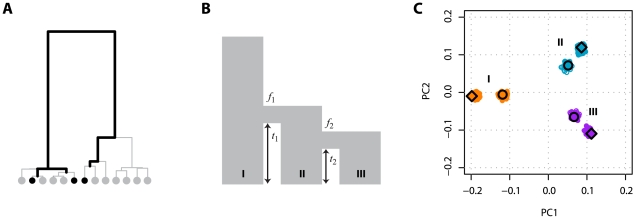
Figure 6. The effect of SNP ascertainment on PCA projection.
(A) In the joint genealogy of the ascertainment (black circles) and genotyped samples (grey circles), only mutations occurring on the intersection of the two genealogies (shown in black) will be detected in both samples. For small discovery panels and large experimental samples, this may be considerably less than half the total genealogy length. (B) Model used to simulate data from three populations linked by two vicariance events, each of which is associated with a bottleneck; the model is an approximation to the demographic history of the HapMap populations [17],[18]. In the simulations 100 haploid genomes with 10,000 unlinked loci were sampled from each population and the parameters are  ,
,  ,
,  ,
,  , where
  is the bottleneck strength measured as the probability that two lineages entering the bottleneck have coalesced by its end (the bottleneck is instantaneous in real time). All populations have the same effective population size. (C) PCA of the simulated data (small open circles) shows strong agreement with results obtained from analytical consideration of the expected coalescence times (large circles). When only those SNPs that have been discovered in a small panel are considered (here modelled as 4, 8, and 4 additional samples from populations I, II, and III respectively) the principal effect is to scale the locations of the samples on the first two PCs (small filled circles) by a factor of approximately
  (large diamonds).

