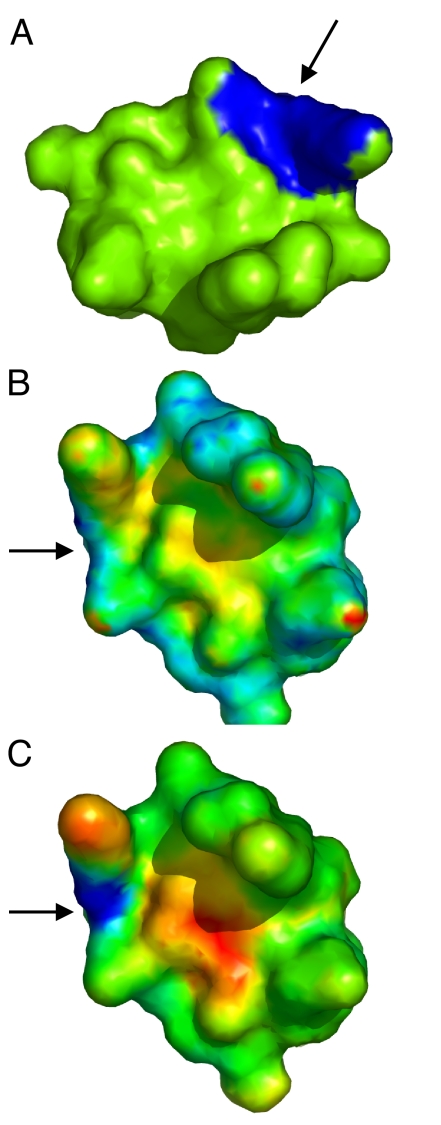
Fig. 1.
Comparison of surface patches using DFSS and AFSS. (A) The query patch is shown in a trypsin inhibitor structure (PDBID 1an1). (B and C) The surface of the same inhibitor structure, but rotated by 120° along the axis perpendicular to the plane of the page. In (B), the DFSS scores of all possible patches are color-mapped onto the surface (blue for lower score and red for higher score). The center of the matching patch is indicated by an arrow. (C) is similar to (B) except that the AFSS score is used. As observed in (C), we can clearly identify the matching patches using AFSS scores, even after rotation and resampling. A funneled shape is observed near the matching site. While using DFSS, the matching patches do not clearly separate from other patches, which makes this score more error-prone on resampling and small surface deformation when compared to AFSS.

