Fig. 2.

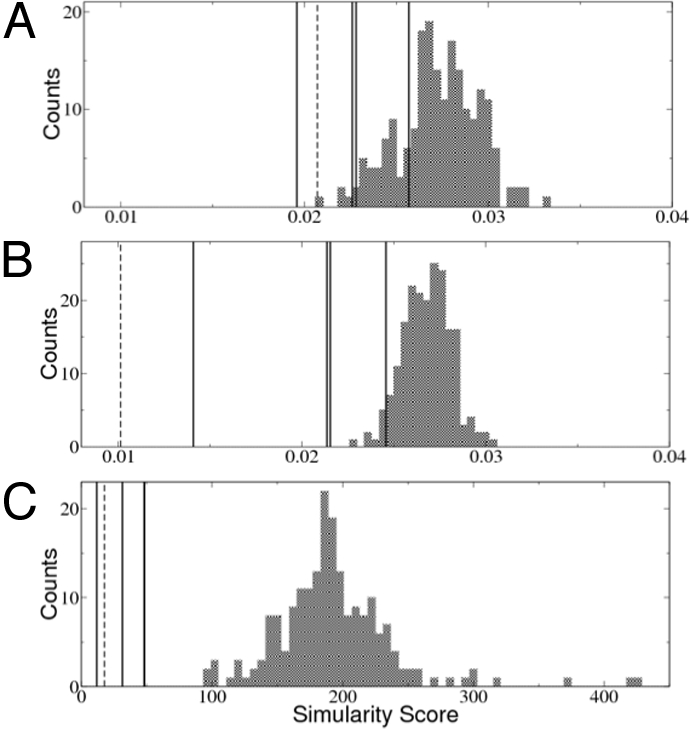
Comparison of the 3 different types of surface similarity scores. These 3 scores are applied to 2 sets of proteins: one set (similarity set) contains 4 proteins having similar surface patches to the query patch of a trypsin inhibitor (the scores are marked as vertical lines); the other set (control set) contains a decoy set of 200 nonhomologous proteins (21) that share no surface similarity with the query patch (the histograms of the scores are shown as bar graphs). In the similarity set, we also include the identical query structure rotated 120° along a randomly chosen axis (dashed lines). (A) The DFSS can only distinguish the rotated protein and a few proteins in the similarity set. (B) By averaging over the neighbor vertices, the AFSS score can distinguish all structures in the similarity set from those in the decoy set. Only a few proteins in the control set achieve better score than the similarity set. (C) Finally, after applying explicit alignment for several of the best-matching patches, the resulting EPSS scores clearly distinguish all of the proteins in the similarity set. Note that only 3 black lines are visible in this plot because 2 of the proteins in the similarity group have nearly identical EPSS scores.
