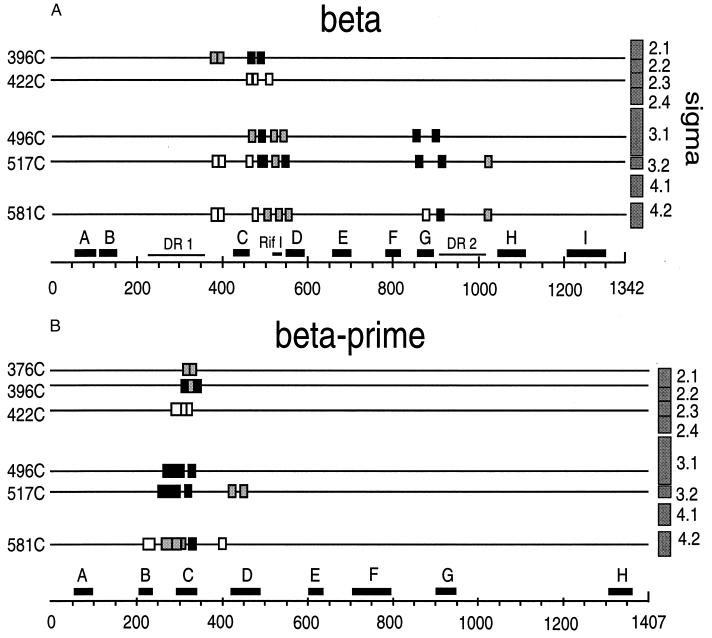
Figure 5.
Summary of cleavage data in Fig. 3, relating proximities of conserved regions of σ70 to sites on β subunit (A), and β′ subunit (B). Darkness of the shaded boxes indicates cleavage efficiency observed on Western blots; box widths indicate estimated errors in assignment of cut sites. Conserved regions of β and β′ are indicated along the horizontal axes.

