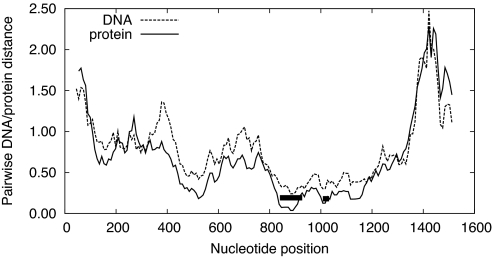
Fig. 1.
Amino acid and nucleotide conservation between mitochondrial atp1 and chloroplast atpA of Arabidopsis thaliana. The plots used sliding windows of 30 aa or 90 NT, slid 3 aa or 9 NT at a time. The y axis corresponds to the estimated number of substitutions/changes per site, with DNA distance measured using the F84 matrix and protein distance using the JTT matrix. The regions involved in gene conversion are marked by bars, with the first corresponding to nucleotide positions 942-1029 (Fig. 2B) and the second to positions 1110–1149 (Fig. 2A). Note that these plots are based solely on the alignment of the 2 Arabidopsis sequences; some coordinates will differ as compared to the multiple sequence alignments.

