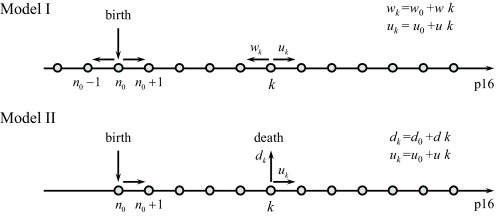
Fig. 1.
Schematic diagram for the models of stochastic p16INK4a expression. The gray dots represent p16INK4a expression levels. In both models, the p16INK4a level increases at a rate uk. Model I includes transitions that decrease the p16INK4a level. These backward transitions occur at a rate wk. In contrast, model II includes transitions that terminate the stochastic process. These transitions occur at a rate dk.

