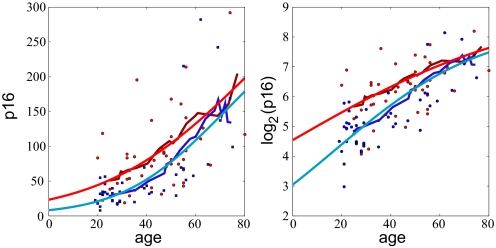
Fig. 6.
Model II results for people who reported exercising >240 min per month (blue dots and curves) and <240 min per month (red dots and curves). The mean initial expression level μ0 is taken to be a free parameter for each group. The estimate values of the parameters are u = 0.021, d = 0.012, μ0 = 8 and u = 0.010, d = 0.010, μ0 = 23, respectively. (Left) The data plotted on a linear scale. (Right) The same data plotted on log2 scale.

