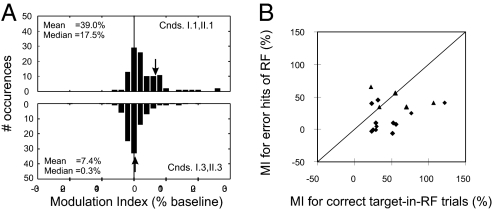
Fig. 3.
Attentional modulation indices for target-in-RF, antitarget-in-RF, and error-to-RF cases. (A) Distribution of modulation indices for sampled neurons. Modulation index was calculated as (response/baseline-1) × 100%, and based upon activity measured during the last 100 ms before saccade onset. (Upper) Modulation indices for target-in-RF condition pooled across Experiments I and II (conditions I.1 and II.1). The distribution is positively skewed (U test, P < 10−10; n = 110 tests), indicating that allocation of attention consistently elevates response rates for a subset of MT neurons. The arrow indicates target-in-RF modulation strength for neuron illustrated in Fig. 2 A–D. (Lower) Modulation indices for target outside RF conditions (I.3 and II.3). The distribution is centered on zero (U test, P = 0.73; n = 93 tests), and is significantly different from the target-in-RF distribution (U test, P < 10−5). The arrow indicates target-out-RF modulation strength for neuron illustrated in Fig. 2 A–D. All data included in these analyses were acquired during trials that concluded with a correct response; the stimulus in the RF of a neuron under study always moved in preferred direction. (B) The comparison of modulation indices obtained from correct target-in-RF trials and incorrect saccades to the RF in target-outside-RF trials (conditions I.3 and II.2–3). Only the cells that exhibited significant modulations during target-in-RF trials and for which sufficient number of error trials were generated were used (n = 17). Triangles denote cells that were significantly modulated during error trials. Diamonds mark cells that failed to reach significant modulations during error trials.

