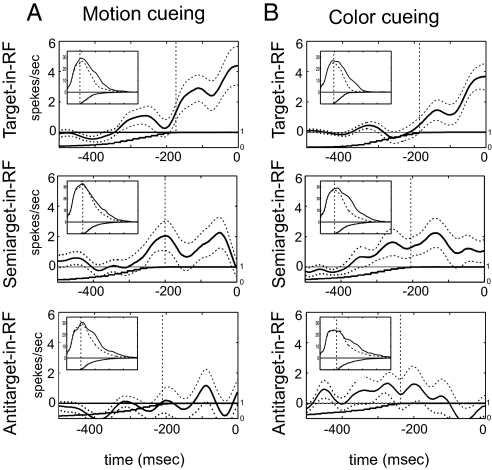
Fig. 4.
Time course of attentional modulations as a function of search condition for Experiment II. (A) Results for motion-cueing conditions. (B) Results for the color-cueing conditions. Continuous line in the main panel represents the population-averaged differential histogram (saccade-aligned histogram minus the matched baseline) calculated for 100-ms sliding window with 1-ms step. Broken error-lines represent standard error of the mean. The monotonic nondecreasing graph below the zero line is the cumulative histogram of saccade latencies, normalized to range from 0 to 1. The vertical dotted lines denote the time point after which all trials contribute to the histogram. The Insets display stimulus onset-aligned histograms (continuous line) with population-averaged matched baselines (broken lines). The vertical lines denote the time point before which all trials contribute to the averaged histogram. Target-in-RF conditions (top row) exhibited characteristic presaccadic modulation of population response (sliding-window Wilcoxon–Mann–Whitney rank-sum test, P < 0.05). A smaller and transient, but significant, modulation of population response was present for semitarget-in-RF condition (middle row). No modulation was seen for antitarget-in-RF condition (bottom row).

