Figure 3.
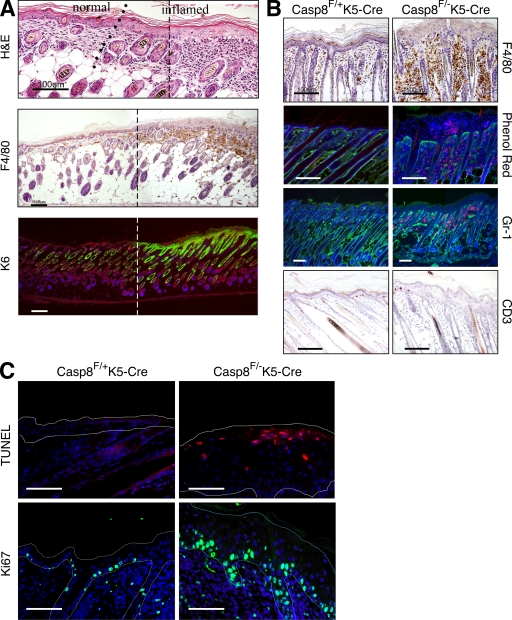
Assessment of inflammation in the skin of Casp-8F/−K5-Cre mice. (A) Multifocal cutaneous inflammation at P5. To allow continuous viewing of the transition area between inflamed and unaffected skin, two overlapping images of adjacent regions in a skin section covering such an area were obtained, and a panoramic image was then constructed using a conventional Photoshop (Adobe) Photomerge routine. The broken line marks the site at which the two pictures were merged. The line of dots in the top indicates the approximate location of the transition point. The micrographs demonstrate epidermal hyperplasia, as well as increased dermal cellularity in the inflamed skin (top, H&E) as a result of infiltration of eosinophils and F4/80-positive cells (mononuclear phagocytes, middle). Interfollicular expression of K6, which is indicative of epidermal hyperproliferation (bottom), is restricted to the thickened epidermal region. Bars, 100 µm. (B) Staining for macrophages (anti-F4/80 antibody), eosinophils (phenol red uptake), granulocytes (anti–Gr-1 antibody), and T lymphocytes (anti-CD3 antibody) in skin sections from Casp-8F/+K5-Cre and Casp-8F/−K5-Cre mice at P7. Note that eosinophils also accumulate within pustules in the epidermis of the Casp-8F/−K5-Cre mice (also marked by arrows in Fig. 2, B and D). Bars, 100 µM. (C) TUNEL staining (top) for assessing apoptosis and Ki67 staining (bottom) for determining cell proliferation rates in the Casp-8F/+K5-Cre and Casp-8F/−K5-Cre epidermis at P7. Fine broken lines delineate approximate contours of the epidermis. Scale bar, 50 µm. The data presented in A, B, and C are representative of analyses of 10, 20, and 4 mice, respectively.

