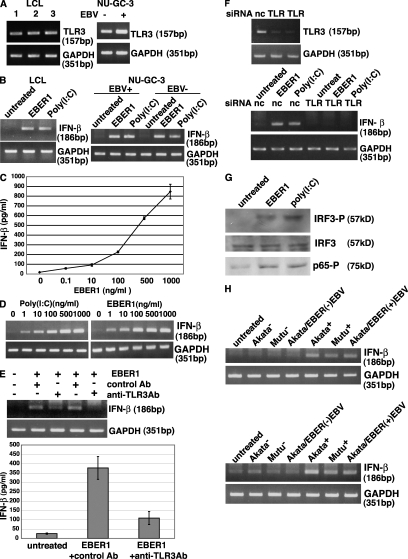
Figure 2.
EBER1 activates signaling through TLR3. (A) Detection of TLR3 in three LCL clones and EBV-infected and uninfected NU-GC-3 cells. Total RNA (0.1 µg) was subjected to 30 cycles of RT-PCR to detect TLR3. RT-PCR for GAPDH was used as an internal control. Three or more independent experiments were performed for each assay. (B) Effect of in vitro–synthesized EBER1 on the expression of IFN-β. LCLs and EBV-positive and –negative NU-GC-3 cells were treated with 0.5 µg/ml in vitro–synthesized EBER1 or poly(I:C) and were cultured for 14 h. Total RNA (0.1 µg) was subjected to 30 cycles of RT-PCR to detect IFN-β. RT-PCR for GAPDH was used as an internal control. Three or more independent experiments were performed. (C) Dose response of the effect of in vitro–synthesized EBER1 on the expression of IFN-β. LCLs (4 × 10⁵ cells/ml) were treated with 0.1–1,000 ng/ml EBER1 and cultured for 14 h. IFN-β in culture supernatants was quantified by ELISA. Error bars indicate the S.D. of duplicate wells. The data presented are representative of three independent experiments. (D) Efficiency of EBER1 and poly(I:C) to induce IFN-β expression in LCLs. LCLs (4 × 10⁵ cells/ml) were treated with 1–1,000 ng/ml EBER1 and cultured for 14 h. IFN-β induction was analyzed by RT-PCR. Three or more independent experiments were performed for each assay. (E) Effect of an anti-TLR3 antibody on EBER1-induced IFN-β production. LCLs were preincubated with the anti-TLR3 antibody for 30 min at 37°C, before being treated with 0.5 µg/ml of EBER1 and incubated for 14 h. The culture was analyzed for IFN-β induction by RT-PCR (upper panel) and ELISA (lower panel). Error bars indicate the SD of duplicate wells. The data presented are representative of three independent experiments. (F) Effect of TLR3 knockdown on EBER1-induced IFN-β production. Negative control siRNA (nc) or TLR3-siRNA (TLR) were transfected into EBER-knockout EBV-infected AGS cells. After 48 h, cells were treated with EBER1 or poly(I:C) and IFN-β induction was analyzed by RT-PCR (bottom). Efficiency of TLR3 silencing was analyzed by RT-PCR (top). Three or more independent experiments were performed for each assay. (E) Effect of EBER1 on the downstream signals of TLR3, IRF3, and NF-κB. LCLs were treated with 2.5 µg/ml in vitro–synthesized EBER1 or poly(I:C) and cultured for 3 h before the phosphorylation of IRF3, and NF-κB was examined by immunoblotting using antibodies against phosphorylated IRF3, total IRF3, and phosphorylated p65. The data presented are representative of three independent experiments. (F) Effect of culture supernatants from EBER-positive cells on the expression of IFN-β. The study includes EBV-positive and –negative Mutu cells, EBV-positive and –negative Akata cells, and EBV-negative Akata cells that were stably infected with EBER-positive EBV or EBER-knockout EBV. The cells (2 × 10⁵ cells/ml) were cultured for 4 d and then the culture supernatants were harvested. LCLs (4 × 10⁵) were treated with 1 ml culture supernatants (top) or RNA extracted from 1 ml culture supernatants in 1 ml culture medium (bottom) for 14 h. RNA (0.1 µg) was subjected to 30 cycles of RT-PCR to detect IFN-β. Three or more independent experiments were performed for each assay.

