Figure 5.
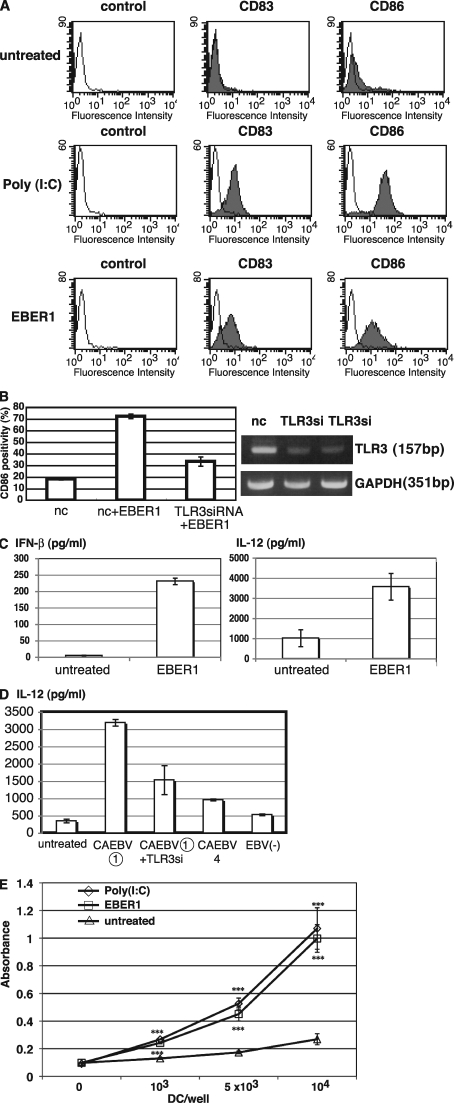
EBER1 induces maturation of DC and subsequent antigen presentation. (A) Effect of EBER1 on phenotype of DCs. DCs were prepared from PBMCs and untreated or treated with either poly(I:C) (10 µg/ml) or EBER1 (10 µg/ml). Surface markers of matured DCs, CD83, and CD86 were measured by flow cytometry. As negative control, cells were stained with mouse IgG. The data are representative of three independent experiments. (B) Effect of TLR3 knockdown on EBER1-mediated DC maturation. DCs were transfected with TLR3 siRNA or control siRNA (nc) and were stimulated with EBER1. CD86 positivity (%) was analyzed by flow cytometry (left). Efficiency of TLR3 silencing was analyzed by RT-PCR (right). Data are shown as the means ± SD of duplicate determination and representative results of three independent experiments are shown. (C) EBER1-induced cytokine production by DCs. DCs were treated with EBER1, and IFN-β or IL-12p40 production were measured by ELISA. Error bars indicate the SD of duplicate wells, and the data presented are representative of three independent experiments. (D) Effect of sera from patients on TLR3-mediated IL-12 production by DCs. DCs were transfected with negative control siRNA or TLR3 siRNA (TLR3si) for 48 h, and then stimulated with sera from patients with CAEBV containing high amounts of EBER1 (CAEBV (1)) and IL-12 production was measured by ELISA. Sera form patients with CAEBV containing low amounts of EBER1 (CAEBV4) or EBV-negative (EBV(−)) healthy donor were also used for stimulation. Data are shown as the means ± SD of duplicate determination and representative results of three independent experiments are shown. (E) Allogenic MLR. DCs treated with either poly(I:C) or EBER1 were used as stimulator cells. Untreated immature DC were also used as stimulator cells. Allogenic PBMCs (1 × 10⁵) were used as responder cells in triplicate cultures. Proliferation of alloreactive T cells was determined by cell proliferation assay. Data are shown as the means ± SD of triplicate determination and representative results of three independent experiments are shown. Statistical significance differences between groups were evaluated by Student's t test. ***, P < 0.001.

