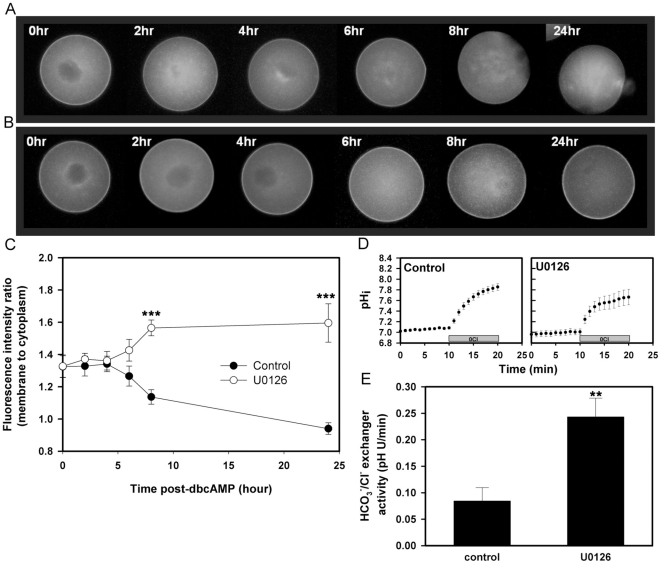
Figure 8. Effect of the MEK inhibitor, U0126, on Ae2-GFP localization and HCO3 −/Cl− exchanger activity in Ae2-GFP-expressing oocytes during meiotic maturation.
Ae2-GFP expressing oocytes were induced to undergo spontaneous GVBD and meiotic maturation by removal from dbcAMP (t = 0) and fluorescence images obtained at the times indicated (hr = hours). Representative fluorescence images are shown of oocytes that were treated with 0.01% DMSO vehicle alone (A) or U0126 (20 µM) (B). (C) Mean (±s.e.m.) plasma membrane-to-cytoplasm Ae2-GFP fluorescence ratios of control and U0126-treated oocytes (as indicated by inset key) as a function of time after dbcAMP removal are shown (N = 3, totally 5–13 oocytes images were quantified for each time point). ***P<0.001 (Student's two-tailed t test for the two measurements at each time). (D) Representative examples of measurements of HCO3 −/Cl− exchanger activity by the Cl− removal assay in Ae2-GFP-expressing oocytes treated with DMSO (control) or U0126 for 8 hours starting at dbcAMP removal. (E) Mean (±s.e.m.) HCO3 −/Cl− exchanger activities of treatment groups as in D (N = 3; 20–30 eggs per group; **P<0.01; Student's two-tailed t test).

