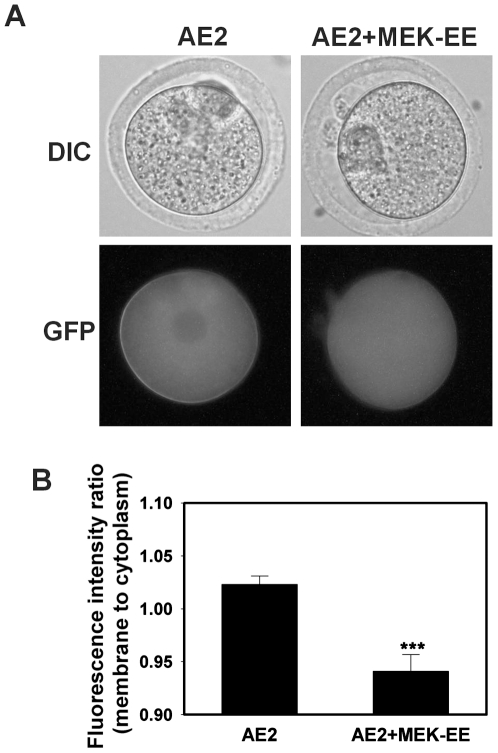
Figure 9. Effect of MEK-EE on membrane localization of Ae2-GFP in eggs following Sr2+ activation.
A) Representative examples of fluorescence (lower panel) and corresponding phase-contrast images (upper panel) of Sr2+-activated eggs expressing Ae2-GFP only (left) or both MEK-EE and Ae2-GFP mRNA (right), at 5 hours after Sr2+ activation. (B) Mean (±s.e.m.) plasma membrane-to-cytoplasm fluorescence ratios of activated eggs as in A (N = 4, 36–50 oocyte images were quantified in each group; *** P<0.001; Student's two-tailed t test).

