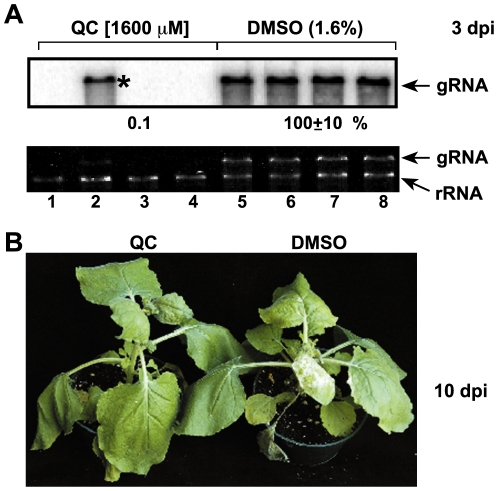
Figure 6. Inhibition of TBSV gRNA accumulation in N. benthamiana plants treated with QC.
(A) Infiltration of leaves with QC (1600 µM), inoculation with TBSV and analysis of RNA samples were done as described under Fig. 5. Note that QC treatment resulted in delay of TBSV symptom formation when compared with DMSO-treated control plants. Note the 40% accumulation of TBSV RNA in one sample (marked with a star), which is likely due to areas in the leaf not (or partly) soaked by the compound during infiltration. Each experiment was repeated three times. DMSO sample was chosen as 100%. (B) The delay in symptom development due to TBSV infections in the QC treated plant (shown on the left) 10 dpi indicates an antiviral activity for QC when compared with the DMSO treatment of plant, which shows more severe symptoms (coloring and stunting).

