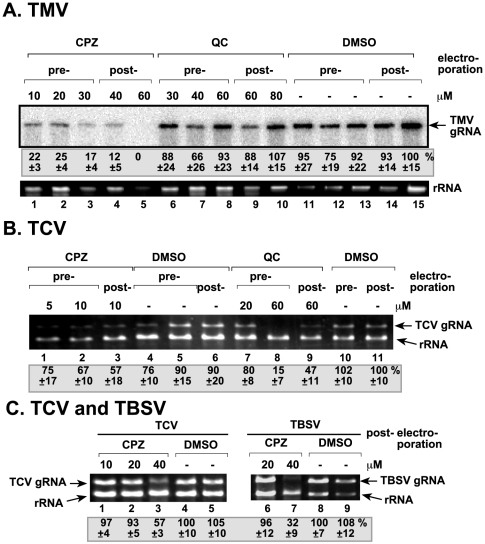
Figure 7. Inhibition of the distantly related TMV RNA and the closely related TCV RNA accumulation in N. benthamiana protoplasts by treatment with CPZ or QC.
(A) Northern blot analysis with a 3′ end specific probe was used to detect the accumulation levels of TMV gRNA. N. benthamiana protoplasts were treated with the shown concentrations of CPZ and QC either before or after electroporation. See further details in the legend to Fig. 1. Note that the % of TMV RNA accumulation was normalized based on rRNA levels in the same samples to correct for sample-to-sample variation. DMSO concentrations were the following: 0.03%, lanes 3, 6, 11; 0.04%, lanes 4, 7, 12; 0.06%, lanes 5, 8, 9, 13, 14; and 0.08% in lanes 10 and 15. (B) Ethidium-bromide stained agarose gel electrophoretic analysis of the accumulation levels of TCV gRNA. N. benthamiana protoplasts were treated with the shown concentrations of CPZ and QC either before or after electroporation. See further details in the legend to Fig. 1. DMSO concentrations were the following: 0.005%, lanes 1, 4; 0.01%, lanes 2, 3, 5, 6; 0.02%, lanes 7, 10; and 0.06% in lanes 8, 9 and 11. (C) Comparison of the inhibitory effect of CPZ on TCV versus TBSV RNA accumulation. Ethidium-bromide stained agarose gel electrophoretic analysis of the accumulation levels of TCV and TBSV gRNAs from the same N. benthamiana protoplasts preparations. The protoplasts were treated with the shown concentrations of CPZ 30 min after electroporation. See further details in the legend to Fig. 1. DMSO concentrations were the following: 0.02%, lanes 2, 4, 6, 8; 0.04%, lanes 3, 5, 7 and 9.

