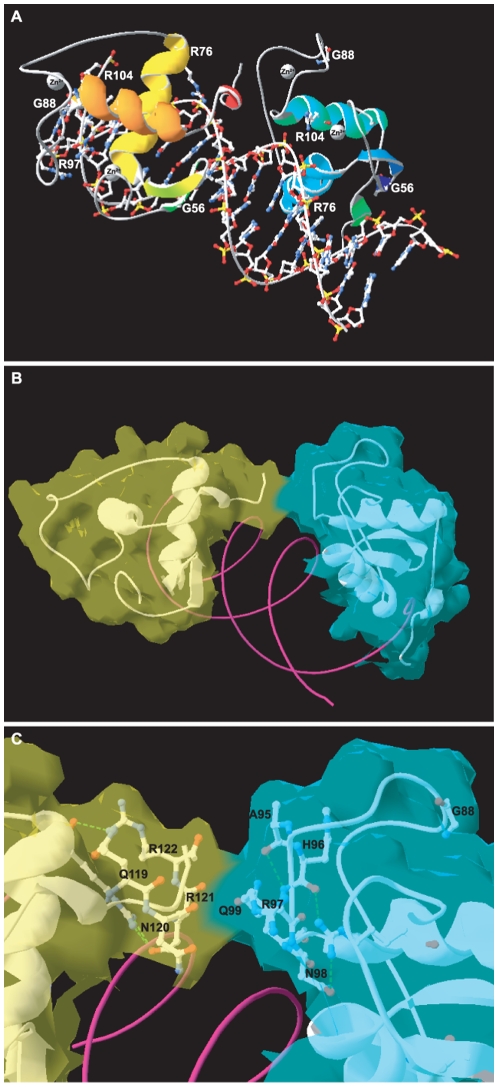
Figure 6. Homology modeling of the NR2E3 homodimer DNA-binding complex.
A) Ribbon view of the NR2E3 DBD homodimer bound to a DR1. Secondary structures of the NR2E3 DBD are shown as ribbons, i.e. starting from the N-terminus, 2 β-sheets of the first Cys4 Zinc finger, and then the 3 α-helixes extending to the C-terminus (see supplemental Figure 4). The left NR2E3 DBD monomer is shown in yellow-orange, and the right one in blue-green colours. Residues mutated in patients are indicated and shown with sidechains. For the DNA double helix all side chains are shown. Zinc ions are shown as grey spheres. Residue G56 is located in the β-sheets of the first Cys4 Zinc finger and spatially segregated from the other analyzed mutations. B) Molecular surface view of the NR2E3 homodimer DNA-binding complex. Molecular surface were represented in light-green for the left monomer and in light-blue for the right monomer. The α-helix of the T/A box of the left NR2E3 monomer (light green) interacts with the second Cys4 Zinc finger of the right NR2E3 monomer (light-blue). The DNA double helix is shown only as ribbon and colored in magenta. C) Close-up view of the dimerization interface. Residues involved in protein interactions are indicated and shown with sidechains. Figures were made with DeepView 4.0 program.

