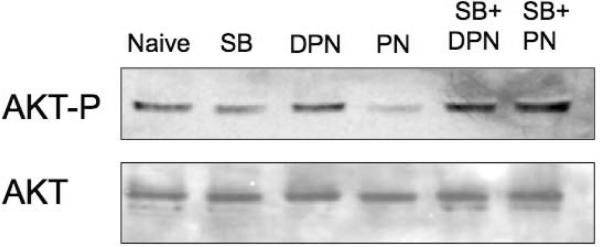
Figure 3. AKT phosphorylation in IEC-6 cells treated with PN.
(A) Cells were treated with PN, or equivalent concentration of DPN for indicated time. Levels of phospho-AKT and total AKT were determined by Western blotting. (B) Levels of phospho-AKT and total AKT in cells untreated naive, or treated with PN or DPN for 1h, with or without pre-treatment with 10 M SB202190 (SB) as indicated. Data are representative of 3 independent experiments.


