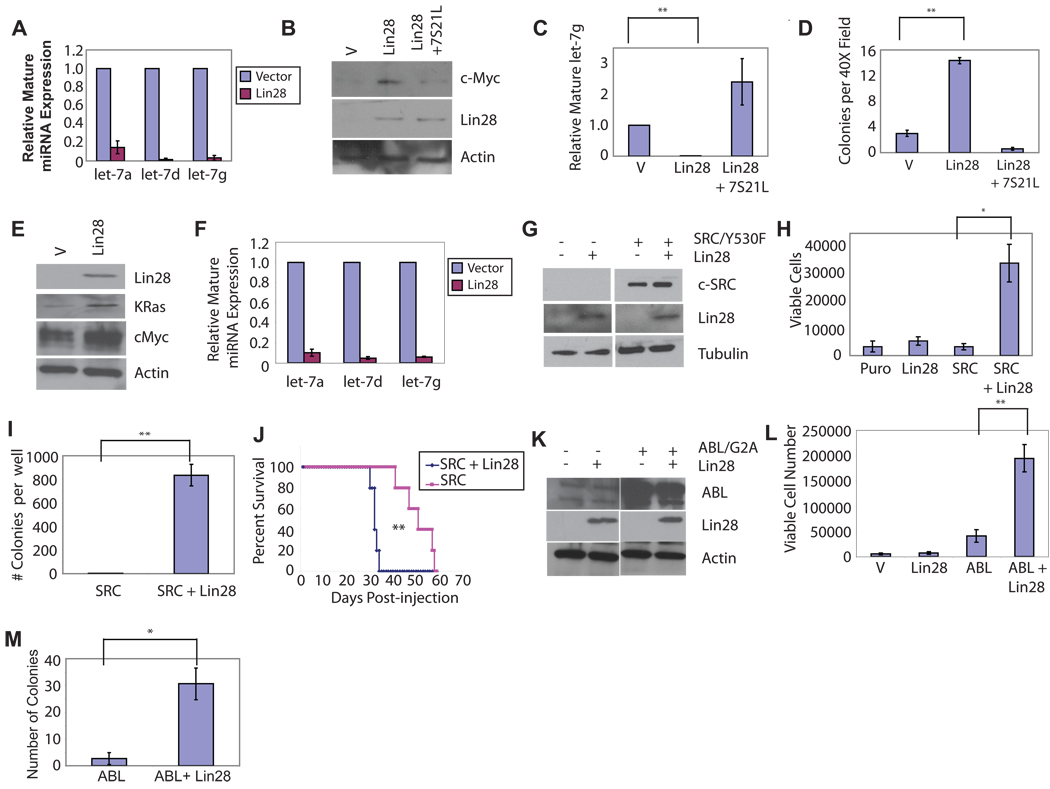
Figure 1. Lin28 Transforms NIH/3T3 cells.
(A) Levels of mature miR species in representative infection determined by quantitative PCR in NIH/3T3 cells infected with pMSCV.Neo or pMSCV.Neo.Lin28, and selected on G418. (B) Western blot analysis of extracts from NIH/3T3 cells infected with MSCV.Neo/pBabe.Puro, pMSCV.Neo.Lin28/pBabe.Puro, or pMSCV.Neo.Lin28/pBabe.Puro.7S21L, selected with Puromycin and G418. (C) Levels of mature let-7g in NIH/3T3 cells infected with MSCV.Neo/pBabe.Puro,pMSCV.Neo.Lin28/pBabe.Puro, or pMSCV.Neo.Lin28/pBabe.Puro.7S21L, selected with Puromycin and G418. (D) Colony numbers in semisolid media for 25,000 NIH/3T3 cells infected with pMSCV.Neo/pBabe.Puro, pMSCV.Neo.Lin28/pBabe.Puro, or pMSCV.Neo.Lin28/pBabe.Puro.7S21L, selected with Puromycin and G418. Colonies were counted after 4 weeks with five random fields counted per well. Results are plotted as average colony number +/− S.E.M., N=3. (E) Western blot analysis on cell extracts from Ba/F3 cells infected with pMSCV.Neo and pMSCV.Neo.Lin28, selected on G418. (F) Levels of mature miR species in representative infection determined by quantitative PCR in Ba/F3 cells infected with pMSCV.Neo or pMSCV.Neo.Lin28, and selected on G418. (G) Western blot analysis on cell extracts from Ba/F3 cells infected with pEYK.Puro.SrcY530F and either pMSCV.Neo or pMSCV.Neo.Lin28 and selected on puromycin and G418 (H) Ba/F3 lines established in (C) were plated in media without IL-3 at 10,000 cells per well. Cells were stained with Trypan blue and viable cells were counted 6d after plating. (I) Colony formation of Ba/F3 cells expressing Src/Y530F or Src/Y530F + Lin28 in semisolid medium, plated at 50,000 cells per well in medium without IL-3. Quantitation of colony number from soft agar assay after 21d of growth. Results are plotted as average colony number per well +/− S.E.M., N=3. (J) Survival of immunocompromised mice injected with 107 Ba/F3 cells expressing Src-Y530F or Src-Y530F+Lin28. Average survival time 51.4d vs. 33.2d vs. respectively, p=0.00276 (K) Western blot analysis of extracts from Ba/F3 cells infected with pBabe.Puro or pBabe.Puro.Lin-28, selected on Puromycin. (L) Ba/F3 lines established in (C) were plated in media without IL-3 at 10,000 cells per well. Cells were stained with Trypan blue and counted 3d after plating. (M) Quantitation of colony number from soft agar assay. Results are plotted as average colony number per well +/− S.E.M., N=3. *, p<0.05; **, p<0.01.

