FIGURE 1.
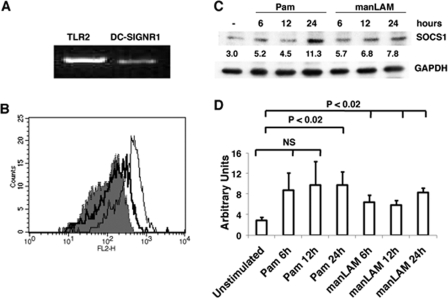
Mouse bone marrow differentiated DCs express TLR2 and DC-SIGNR1 that when stimulated induce SOCS1 expression. A, reverse transcription-PCR of TLR2 and DC-SIGNR1 mRNA enriched from DCs differentiated from bone marrow with GM-CSF. B, histograms depicting the relative surface levels of DC-SIGNR1 (thick line) and TLR2 (thin line) on DCs differentiated from bone marrow with GM-CSF. The shaded histogram depicts staining with streptavidin-phycoerythrin. For C, DCs were stimulated with 1 μg/ml Pam3Csk4 (Pam) or 5 μg/ml manLAM for the indicated times. Post-incubation, cytoplasmic extracts were Western blotted for SOCS1. Numbers below the SOCS1 blot indicate relative intensities of the bands. Data from one of three independent experiments are shown. For D, densitometric values of the three SOCS1 blots were employed to graphically represent SOCS1 levels in different treatments. Bars represent mean ± S.D. of the three independent experiments. NS indicates means between indicated groups were not significant at p > 0.05.

