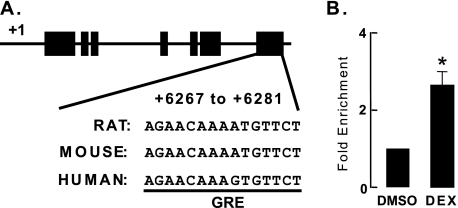
FIGURE 3.
Identification of an Angptl4 GRE. A, schematic diagram of rat Angptl4, including the location of the predicted GR binding site. Black boxes represent exons, and lines connecting them represent introns. The predicted GR binding site sequences (AGAACATTTTGTTCT) and their conserved counterparts in human and mouse genome are shown. B, ChIP experiments confirming the recruitment of GR to its predicted binding site. H4IIE cells were treated with either DMSO or DEX (0.5 μm) for 30 min, after which they were harvested for ChIP as described (“Experimental Procedures”). Shown is the fold-enrichment of GR binding by DEX treatment (DEX/DMSO) from three independent experiments (*, p < 0.05). The error bars represent the S. E. for the fold enrichment.

