FIGURE 8.
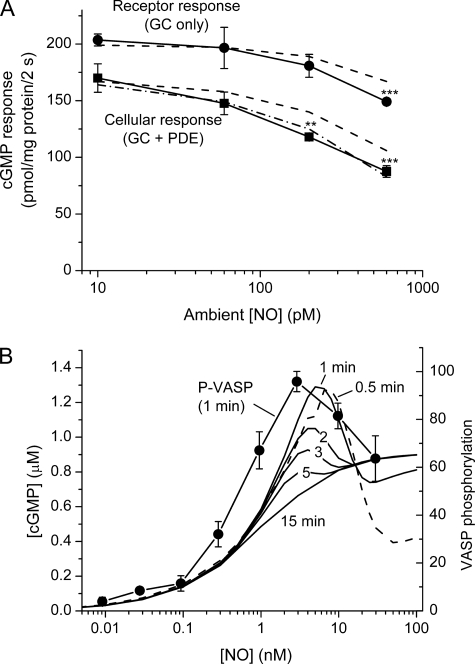
Effects of tonic NO exposure in rat platelets. Data in A show cGMP responses after 2-s applications of a 50 nm NO pulse with and without sildenafil (100 μm) measured after 20 min of incubation in a range of clamped NO concentrations in the subnanomolar range. p < 0.05 (*), p < 0.01 (**), and p < 0.001 (***) compared with control (untreated) platelets (t test). Broken lines are model predictions with GCmax = 127 μm/s, Vp2 = 90 μm/s, and k3 = 1 × 10⁷ m−1s−1. The dash-dot line assumes an additional more stable active PDE5 state (see the legend to Fig. 1A). The clamped NO concentrations were achieved using a mixture of diethylenetriamine NONOate and CPTIO (50 μm). In B the lines are the cGMP concentrations predicted by the model (Fig. 6 and Table 1) to exist in platelets subjected to various NO concentrations for 0.5–15 min (indicated for each curve; the 0.5 min line is dashed for clarity); data represent the levels of VASP phosphorylation (arbitrary units) measured in rat platelets after 1 min of exposure to different NO concentrations (13).

