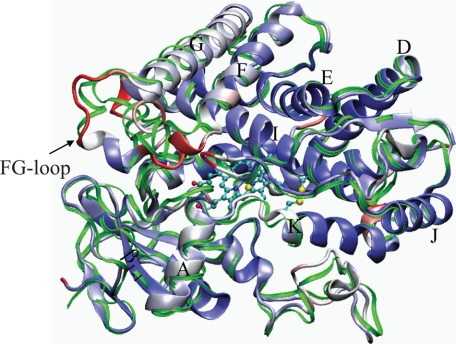
FIGURE 3.
Comparison of the average backbone structures of CYP2B1 WT and the Y309C/S360C variant obtained from a 2-ns MD simulation. Both structures were averaged from 1.2 to 2 ns when the system had fully reached equilibrium. The backbone of the WT is a thin green ribbon, and the backbone of the Y309C/S360C is depicted as a thick ribbon and colored by the Cα displacement from the WT from blue (zero) to red (maximum). The heme and side chains of Cys309 and Cys360 are depicted in stick and ball form, sulfur, carbon, and oxygen atoms are colored yellow, cyan, and red, respectively. The FG-loop, β1-1 sheet, and eight helices (A, D, E, F, G, I, K, and J) are labeled.

