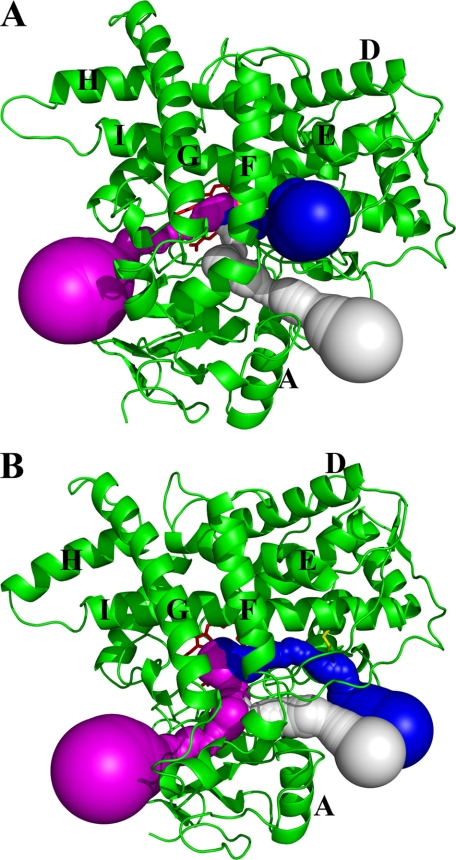
FIGURE 4.
Access channels identified from the average structures of CYP2B1 WT and Y309C/S360C using the Caver program. A, access channels for WT; channels 1, 2, and 3a are shown as white, magenta, and blue spheres, respectively. B, access channels for the Y309C/S360C variant. Channels 1, 2, and 3b are shown as white, magenta, and blue spheres, respectively. The protein backbones are depicted as green ribbons and the disulfide bond as a yellow stick.

