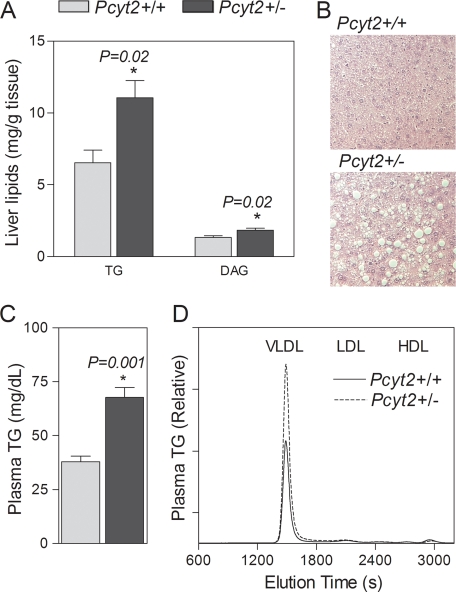
FIGURE 4.
Pcyt2+/− mice have fatty liver and hypertriglyceridemia. A, liver TG and DAG content (n = 8/group). B, histological analyses of Pcyt2+/− and control livers, fixed in paraffin, sectioned at 10 μm, and stained with hematoxylin and eosin (×100); the values are representative of at least four mice for each genotype. C and D, total plasma TG (n = 8/group, C) and lipoprotein profile of plasma TG (n = 6/group, D). The results are from 32–36-week-old mice. VLDL, very low density lipoprotein; LDL, low density lipoprotein; HDL, high density lipoprotein.

