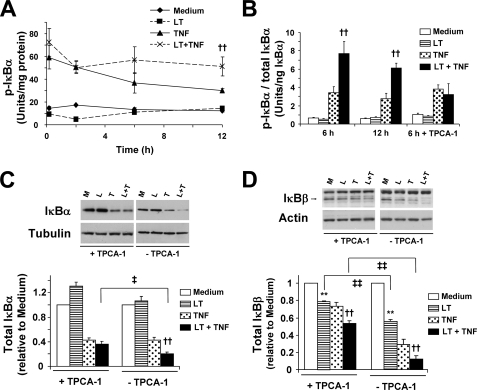
FIGURE 5.
LT enhances TNF-induced phosphorylation of IκBα and IκBα and IκBβ degradation. A, quantitation of p-IκBα was performed by ELISA as described under “Experimental Procedures” and presented as units of p-IκBα per mg of protein. Means ± S.E. for three separate experiments are shown. B, quantitation of p-IκBα relative to total IκBα was performed by ELISA and presented as units of p-IκBα relative to nanograms of total IκBα. Where indicated, cells were pretreated for 30 min with TPCA-1 (3 μm). Means ± S.E. for three separate experiments are shown. C and D, cells were pretreated for 30 min with TPCA-1 (3 μm). Whole cell lysates were analyzed by Western blot for expression of IκBα (C) and IκBβ (D). Three blots were performed for each protein, and representative blots are shown. Graphs represent Western blot densitometry (n = 3) of total IκBα (C) and total IκBβ (D) in TPCA-1-pretreated cells. Data for samples without TPCA-1 are modified from Fig. 1 and are included here for comparison. M, medium; L, LT; T, TNF; L + T, LT + TNF. **, p < 0.01 versus medium; ††, p < 0.01 versus TNF; ‡‡, p < 0.01 comparing with TPCA-1 versus without TPCA-1; ‡, p < 0.05 comparing with TPCA-1 versus without TPCA-1.

