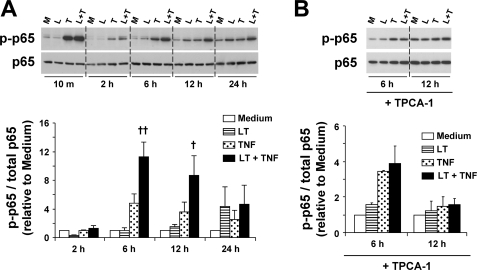
FIGURE 6.
LT enhances TNF-induced phosphorylation of p65. A, whole cell lysates were analyzed by Western blot for p-p65 and total p65 levels. At least three blots were performed. Blots are shown for a representative set of 10-min and 2-h samples grouped on one gel and the 6-, 12-, and 24-h samples grouped on a second gel. Graphs represent Western blot densitometry (n ≥3). Data were normalized relative to cells treated with medium alone and presented as means ± S.E. B, cells were pretreated with TPCA-1 (3 μm) and analyzed for p-p65 and total p65 levels as described above. M, medium; L, LT; T, TNF; L + T, LT + TNF. ††, p < 0.01 versus TNF; †, p < 0.05 versus TNF.

